Britain has improved its position among the world’s top manufacturing nations, moving up the league table to its strongest position since 2008
The UK was the world's eighth-biggest nation by manufacturing output in 2015 – the most recent year for which internationally comparable data are available – with just over 2 per cent of total output, according to calculations by Made Here Now based on the latest figures from the United Nations' statistical database.
The numbers underline the relative strength of Britain's position in world manufacturing, even in the face of the rapid advances over the past 20 years by developing nations led by China, which claimed the largest share of world manufacturing in 2015 followed by the US, Japan, Germany, South Korea, India and Italy.
"This performance reflects the renaissance that manufacturing is currently undertaking through a consistent focus on innovation, research and development and high-value skills," said Terry Scuoler, chief executive of the EEF manufacturers' body.
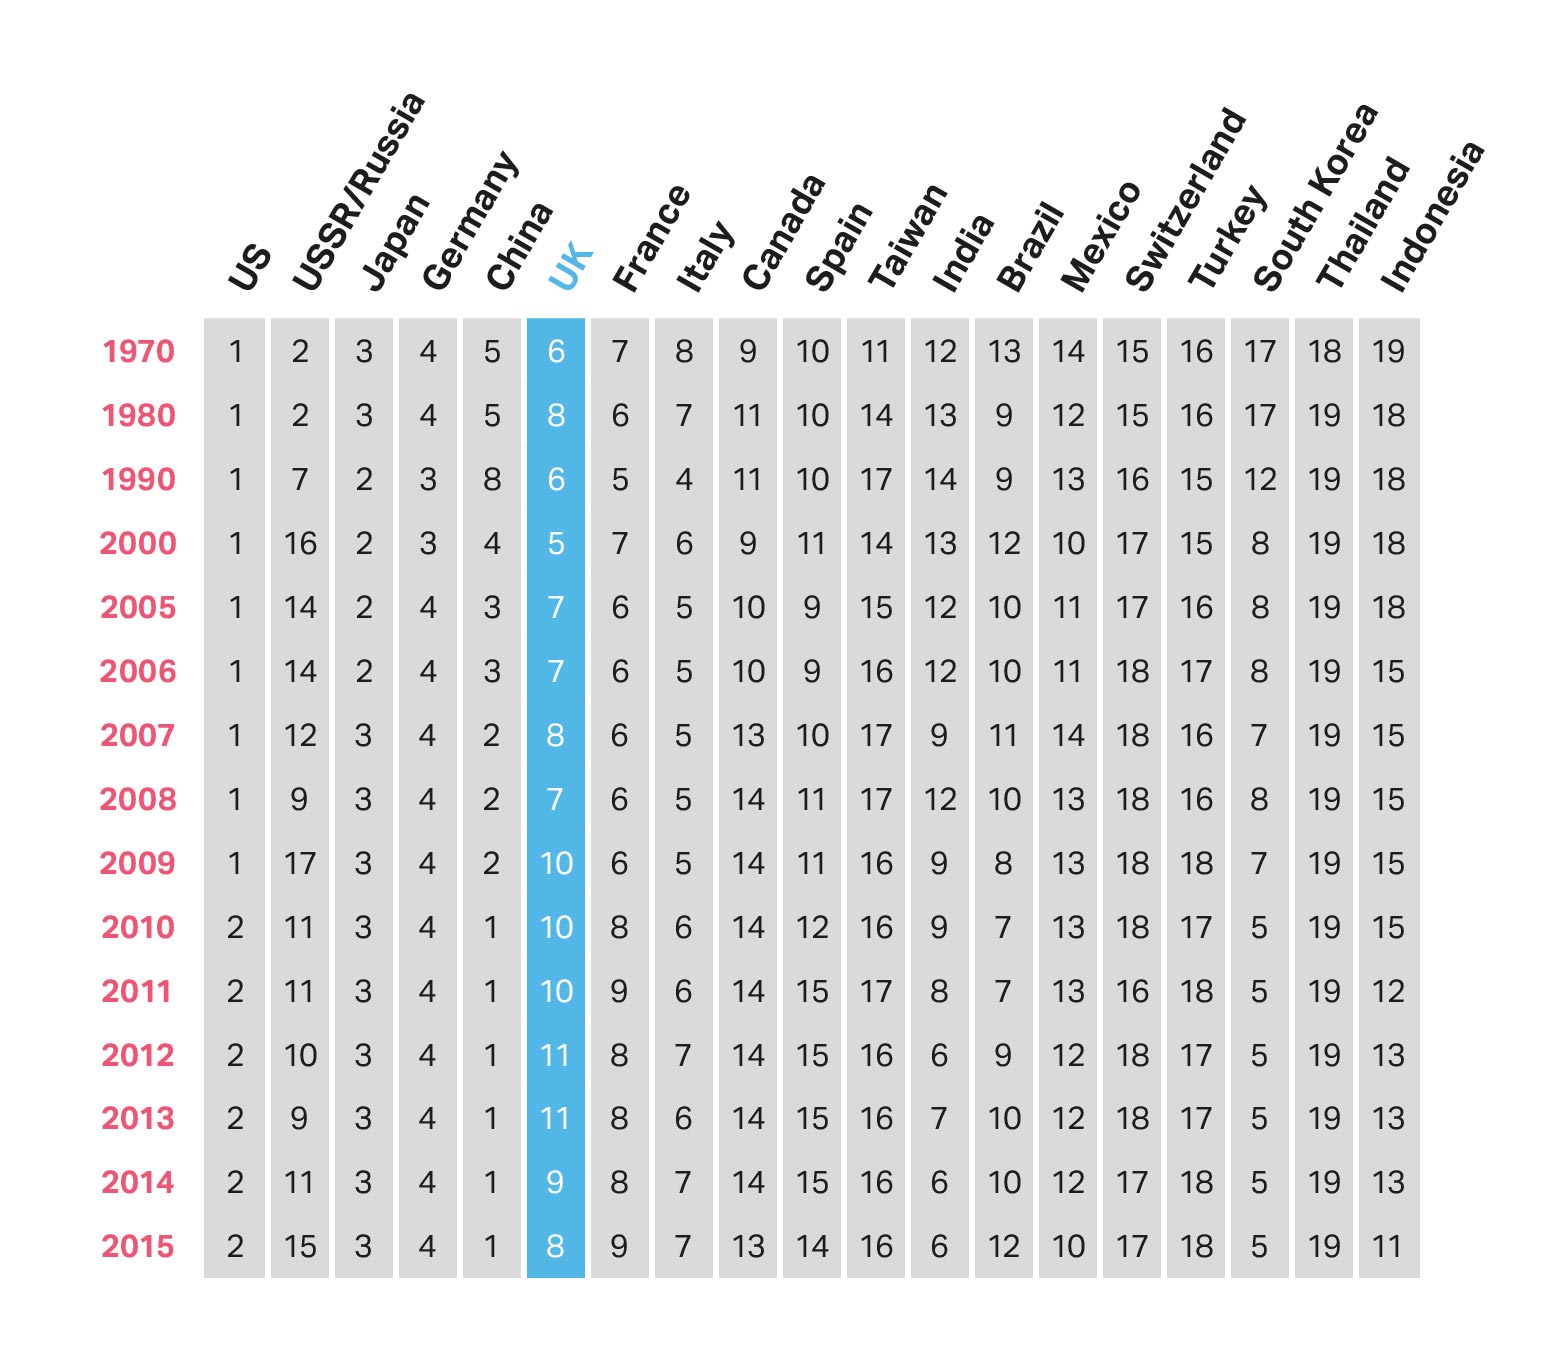 Fig. 1: World manufacturing rankings by output, 1970 – 2015, based on shares of top 19 countries in global manufacturing. In 2015 world manufacturing output was $11.7 trillion out of world GDP of $74.2 trillion. For notes on data see end of story.
 Made Here Now plans to highlight the opportunities ahead, focusing especially on the potential role for younger people, whom many companies say they want to recruit to develop skills and technologies in fields such as digital factories, artificial intelligence and 3D printing.
While some industry experts fear that the UK's planned exit from the European Union will weaken British manufacturing, others believe that Brexit provides the opportunity to boost the sector, perhaps helped by the government's much vaunted new industrial strategy.
The UN data provide a snapshot of different countries' relative strengths in manufacturing output, registered as shares of total value-added production calculated at 2015 dollar values. The figures provide a unique way to compare the performance of countries since 1970. In 2015 world manufacturing output came to $11.7 trillion.
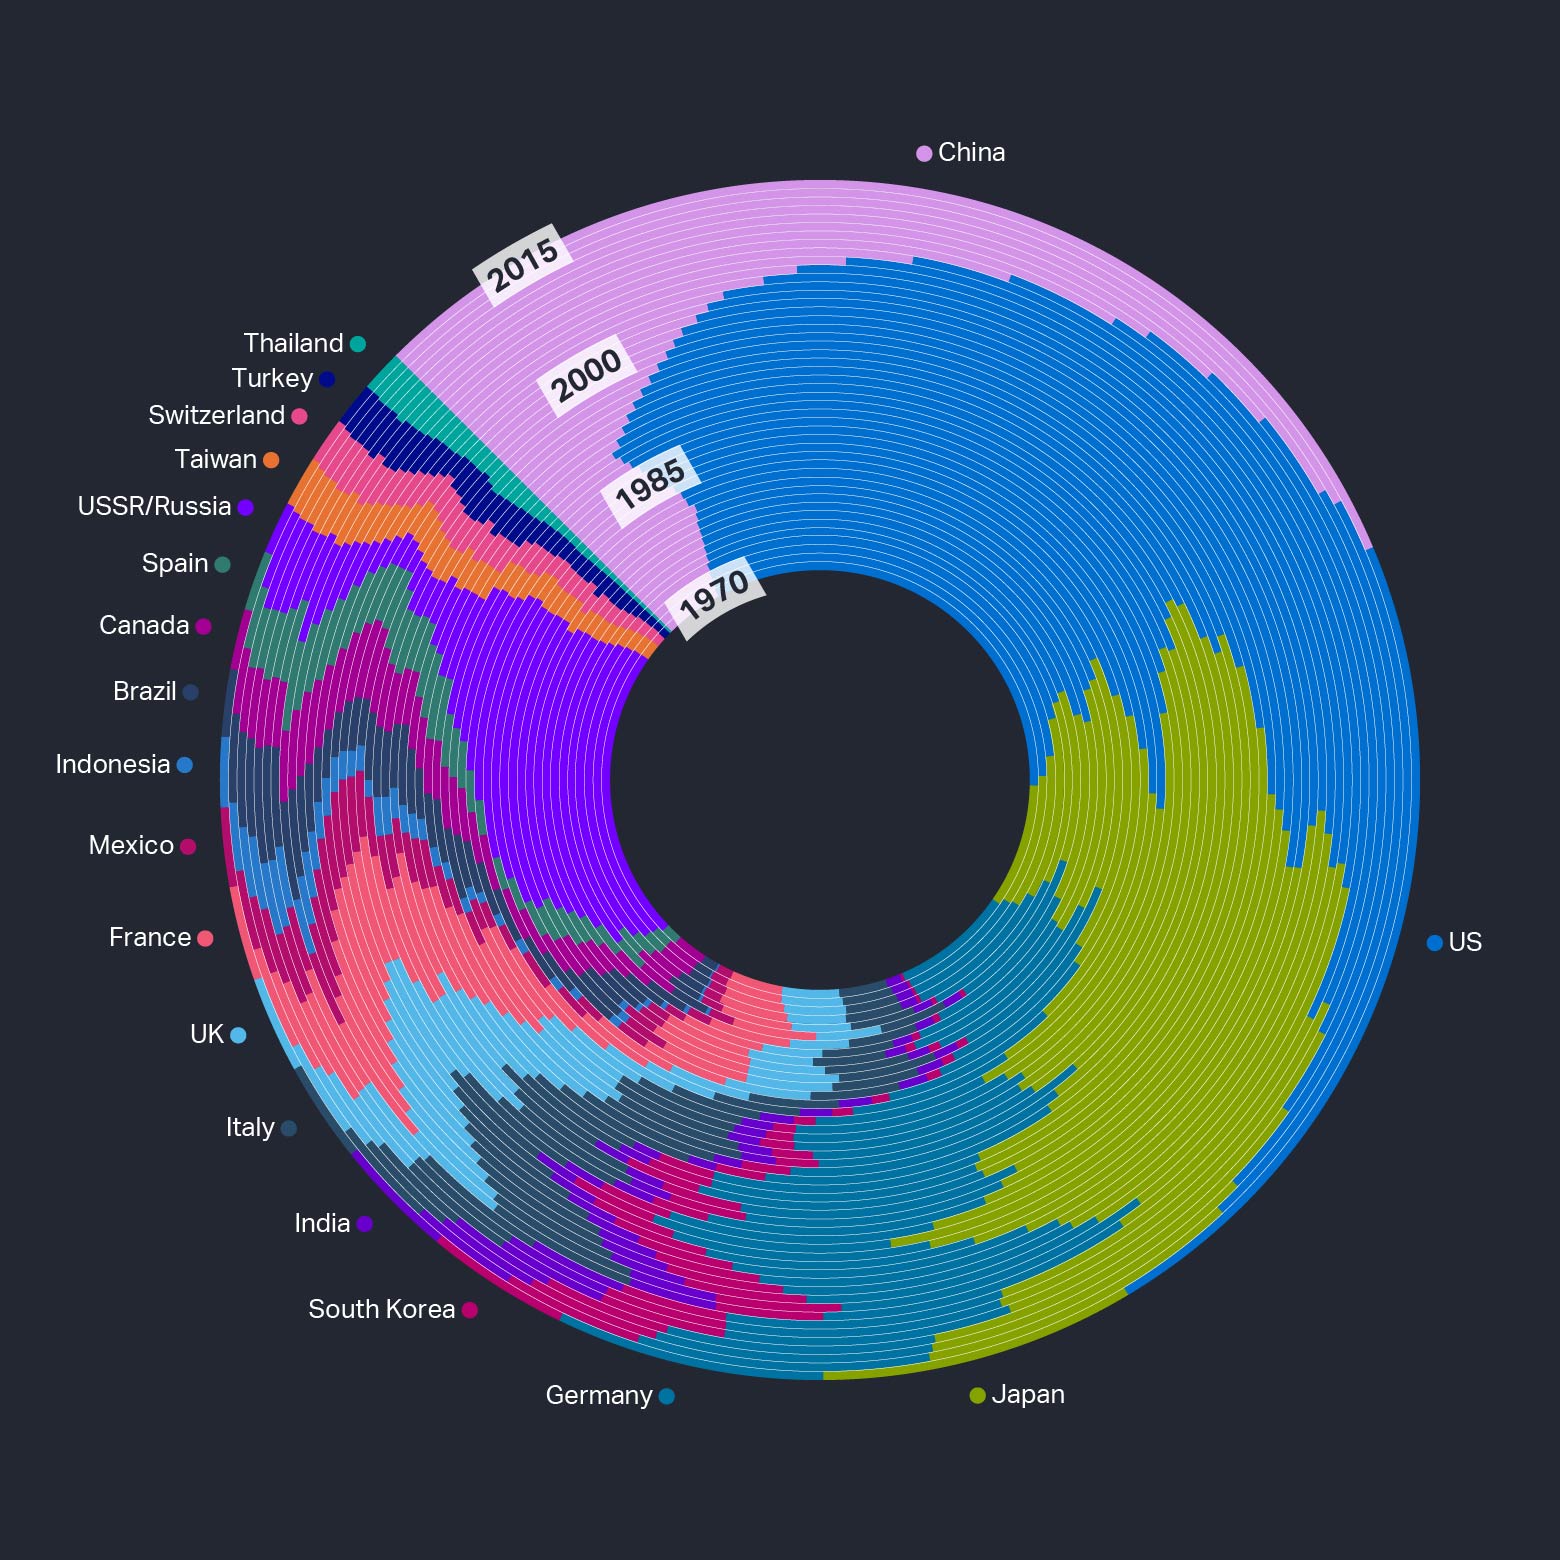 Fig. 2: World manufacturing shares, 1970 – 2015, showing data for top 19 countries. Each concentric circle represents a specific year. The space occupied by each country on these circles indicates that nation's share of global manufacturing output in the year in question.
According to the data, the UK accounted for 2.1 per cent of world manufacturing output in 2015, putting it in eighth position. In 2014 it ranked ninth, albeit with a slightly larger share of total output.
The last time the UK was higher in the league table came in 2008 when it was seventh.
The country’s relatively strong showing in 2015 follows a long slide down the global manufacturing pecking order as developing nations made inroads. In the late 1990s for instance the UK was fifth, with about 4 per cent of world manufacturing production.
The Made Here Now analysis records the evolving performance of the world’s top 19 manufacturing nations over the 45 years to 2015, as measured by their share of total output (see Figures 1, 2 & 3).
Because this way of making comparisons requires the value of all countries' production in their national currencies to be converted into dollars at prevailing exchange rates, it is subject to currency fluctuations that can distort different nations' positions in specific years. Even so this approach, which nets out investments and disinvestments – including reshoring decisions – is regarded as one of the best ways to illustrate long-term performance at the national level.
The UK and US positions in 2015 were helped by a period of sterling and dollar strength. However the appreciation in these currencies also weakened the competitiveness on currency grounds of UK and US manufacturers and so might have had an impact in depressing their output.
China's rise to pre-eminence dates from 2010, when it ended more than a century of dominance by the US. In 2015, the Chinese share was 25.4 per cent – its highest ever – compared with just 7 per cent in 2000.
However, the new analysis shows that in 2015 the US bounced back somewhat, increasing its share of world output to 18.6 per cent, up from 17.1 per cent in 2015.
This is the US's highest figure since 2009 and comes after a prolonged period of new investments in US manufacturing helped by low energy costs and much talk about reshoring opportunities. Hal Sirkin, a manufacturing expert at Boston Consulting Group, said: “This is proof that Made in America is taking hold.”
The new US president, Donald Trump, plans to build on this relatively strong base by encouraging new investments in US manufacturing for instance through tax incentives. In the early 2000s the US routinely claimed more than 20 per cent of world output.
One reason for Britain's slide down the rankings over the past 15 years has been due to the robust showings of other nations that until recently were not considered to be strong industrial powers.
The charge has been led by South Korea - which has leapt from number 12 in 1990 to number five in 2015, while India has progressed from twelfth to fifth over the same period.
However Britain's relatively good position in 2015 has been helped by a weakness in Brazil and Russia - two nations that had been progressing strongly in manufacturing but that fell back owing to local economic difficulties.
In 2015 Britain moved ahead slightly of longtime rival France and was only just behind Italy.
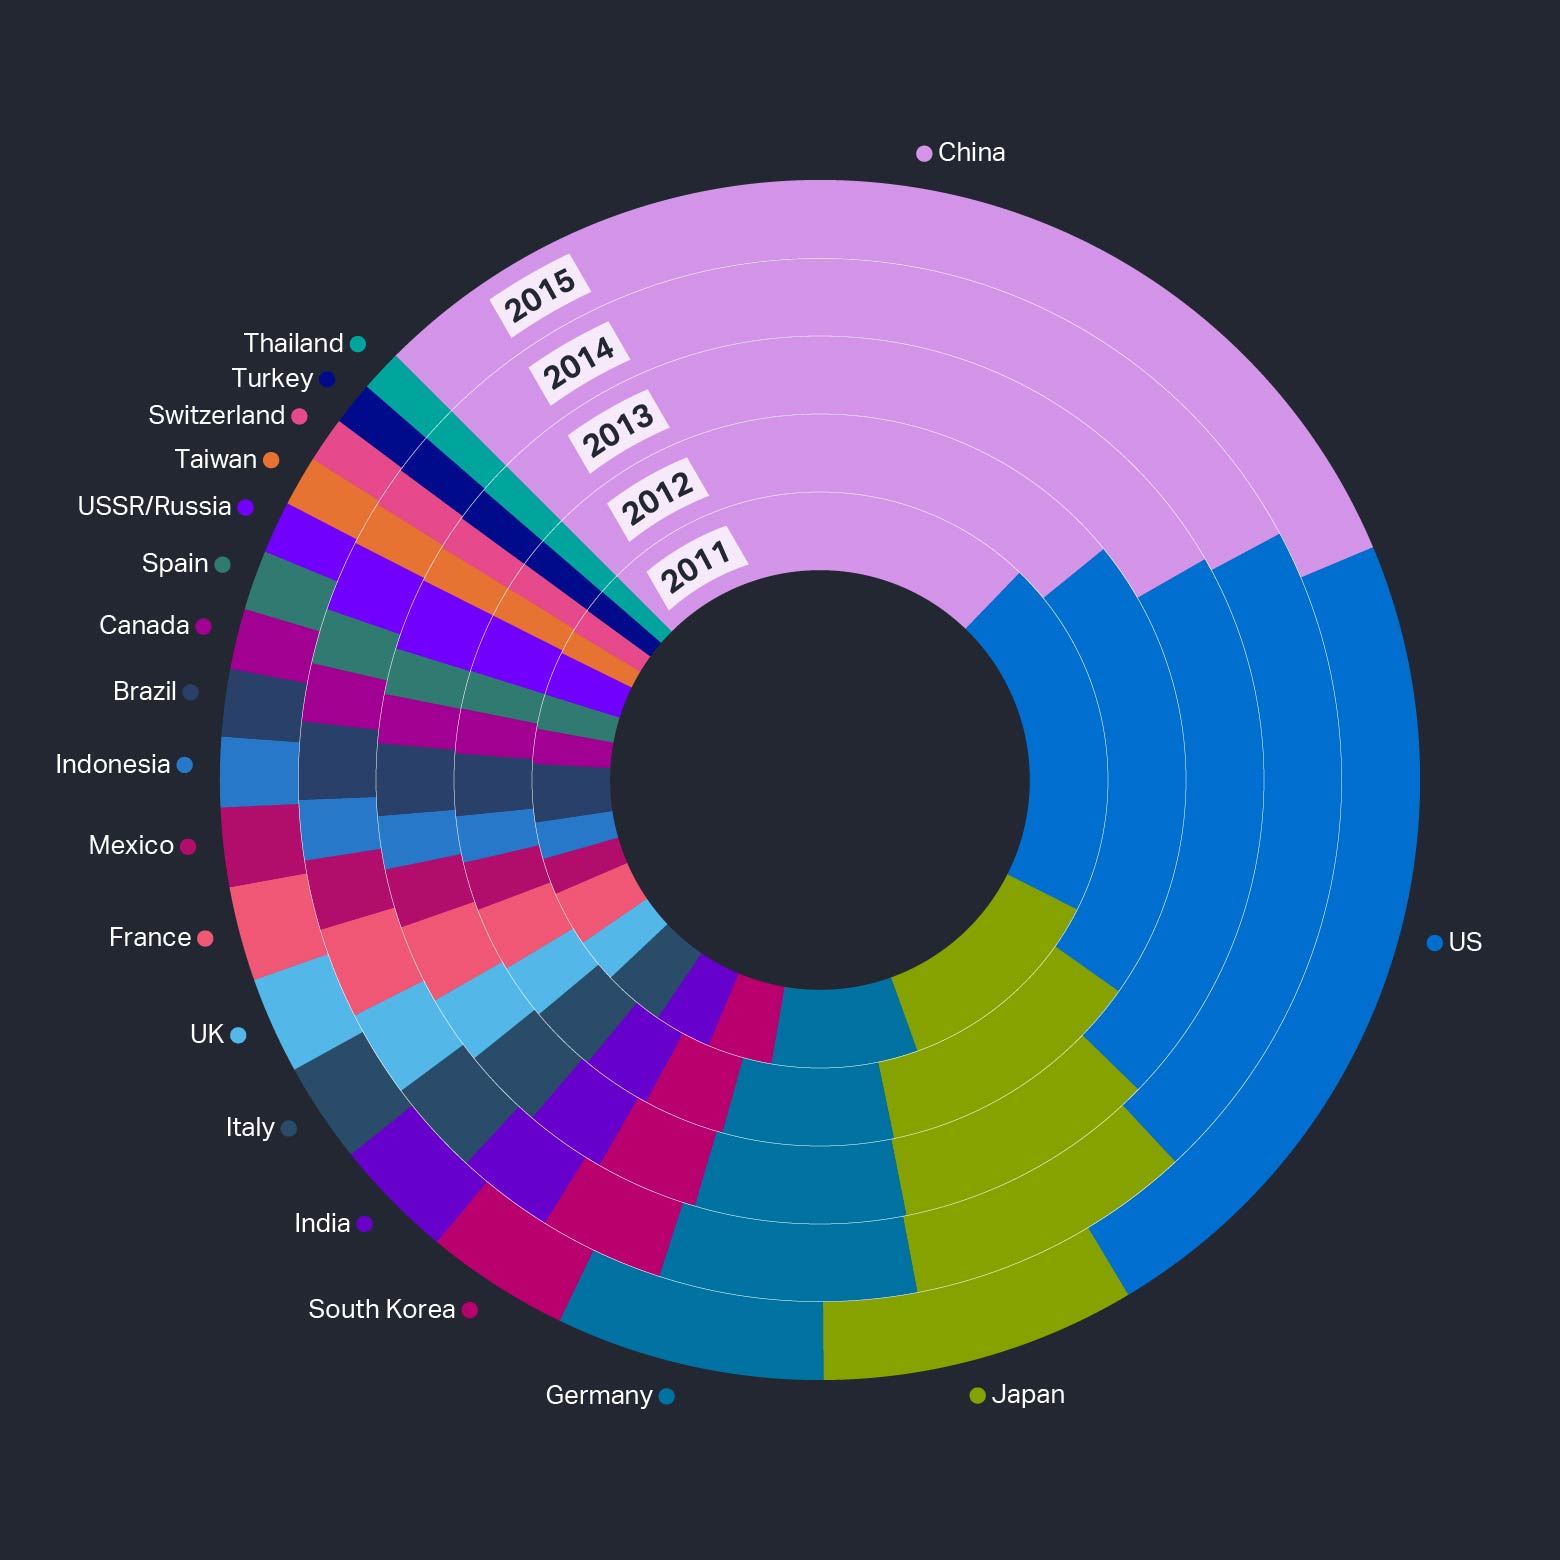 Fig. 3: World manufacturing shares, 2011 – 2015, showing data for top 19 countries.
If Britain can continue to score well in manufacturing in the next few years there is a good chance it could overtake Italy, whose economy is struggling. Britain is considered unlikely to catch up with faster-growing South Korea and India, which are sixth and fifth in the league table.
The chances of Britain ever again claiming the number one spot in world manufacturing that it occupied in the late 19th century - a result of the country’s stellar role in capitalising on the industrial revolution - are virtually non-existent. Even so, the new data indicate that there is plenty of life left in the UK’s manufacturers – and much to play for over the next few years.
Data Source: Made Here Now analysis based on data from UN National Accounts Main Aggregates Database , uploaded January 2017, with data from 1970 to 2015. http://unstats.un.org/UNSD/snaama/dnlList.asp.
Notes: figures for countries' manufacturing output in value added are in current year US dollars.Data for Taiwan are Made Here Now estimates, as are data for China to 2003. Data for USSR/Russia are for USSR to 1989,Russia after this.